16 OCTOBER 2026
AI and product search: Q2 2026 data
Our analysis of artificial intelligence’s impact on the ecommerce sector is updated with data from the first quarter of 2026. Although referral traffic from these platforms still represents a marginal share (often less than 1% of a site’s total traffic), monitoring it is useful for understanding the evolution of search habits and the sustainability of new models introduced by AI players.

How AI assistants changed (Q2 2026)
The second quarter of 2026 brought a further evolution in the integration between virtual assistants and ecommerce, marked by growing competition among the leading models and the expansion of native transactional search formats.
- ChatGPT (OpenAI): In April, OpenAI began integrating product feeds (such as Shopify’s) directly into shopping conversations, letting it display items and prices in real time. In May, it refined its browsing agents (Operator) to guide the user through product comparison all the way to the final cart step.
- Google and Gemini: In May, Google introduced the native ai-assistant channel in GA4 and began testing turning the search button into an AI Mode button. That same month, dynamic cards linked to Merchant Center started appearing at the top of the page for commercial queries.
- Perplexity: In May, Perplexity enabled direct syncing with e-commerce catalogs, letting users compare specs, prices and stock levels across stores in real time.
- Claude: In June, Anthropic strengthened Claude’s data-analysis capabilities for processing complex technical spec sheets, confirming its predominant use in professional and B2B contexts rather than retail.
These developments confirm that the search journey is fragmenting further across platforms. The real impact on conversions still remains to be verified over time.
Ecommerce sector impact (Q2 2026)
Q2 2026 data shows a clear acceleration in AI-driven referral traffic volumes. Sessions rose +37.7% compared to the first quarter of the year. Year-over-year (vs. Q2 2025), the channel confirms sustained growth, up +142.2%.
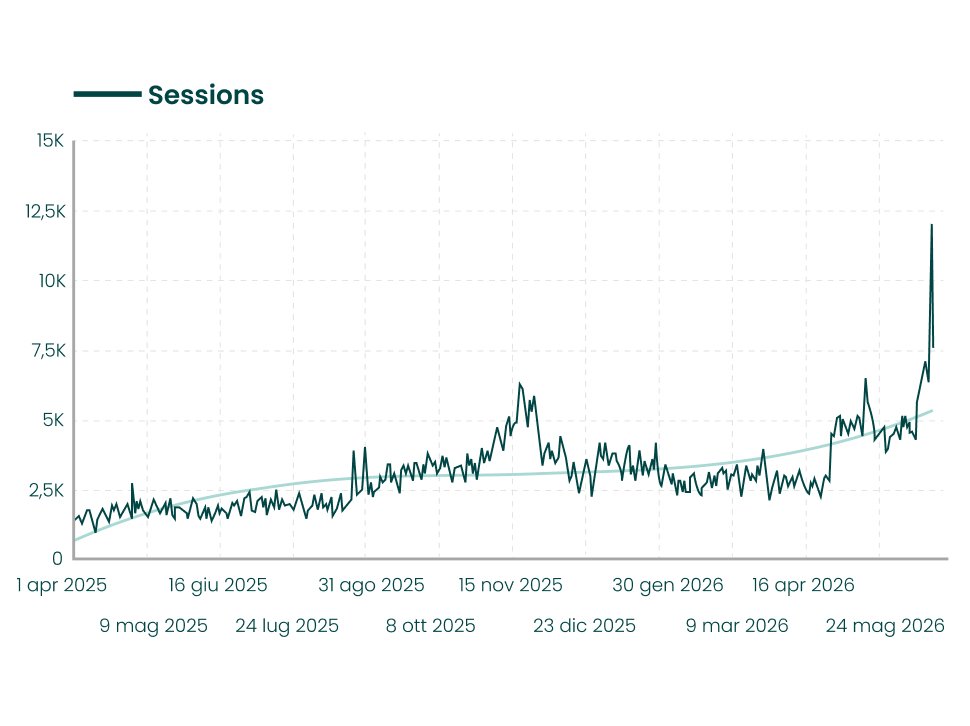
Despite the volume increase, engagement and conversion metrics show that traffic qualification levels are holding steady:
- Engagement: Bounce Rate stands at 23.2%, essentially stable vs. Q1 (-0.2%) and down -25.9% year-over-year. Average session duration dropped to 44 seconds (-18.4% vs. the previous 91 days).
- Conversione: The Add to Cart Rate (ATC) remains high at 7.3%, a marginal -1.6% dip quarter-over-quarter, but up +29.0% vs. the same period in 2025.
Shorter sessions (44 seconds), a contained Bounce Rate (23.2%) and a high ATC Rate (7.3%) together point to a faster transactional phase. Guided by the conversational interface’s preliminary answers, the user tends to land on the site with the key information already in hand, cutting the time needed before adding the product to the cart.
Top AI referral sources (Q2 2026)
Traffic source analysis for the second quarter of 2026 shows a consolidation of the leading player’s share, driven both by market penetration and by differences in tracking accuracy across platforms.
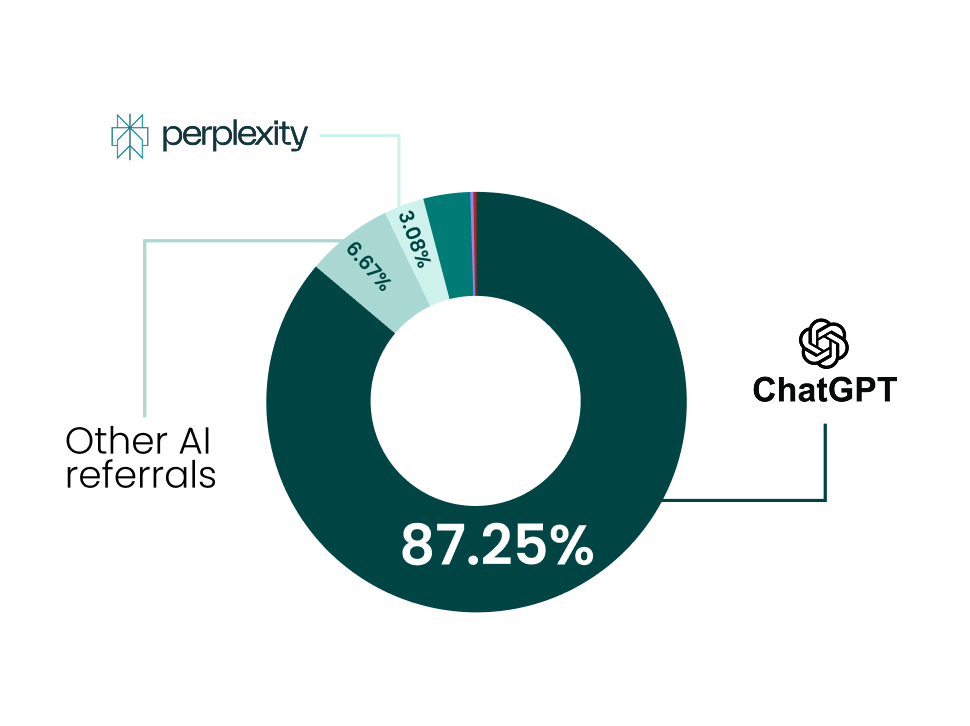
- ChatGPT: Accounts for 87.25% of overall referral sessions (up from 85.67% in Q1). Its ability to preserve tracking of mobile-app visits lets OpenAI keep a substantial share of measurable traffic to ecommerce sites.
- Other AI referrals: Represent 6.67% of total visits (up from 6.09% the previous quarter), pointing to a steady presence of smaller engines and assistants in users’ discovery mix.
- Perplexity: Posts 3.08% of sessions (vs. 4.12% in Q1), confirming itself as the second-largest direct traffic source by volume.
- Gemini: Stands at 1.87% of direct referral traffic (down from 3.60% in Q1). The decline is largely due to the platform’s tendency to redirect users to Google SERPs before the final site visit.
- Copilot: Grows in relative volume, reaching 0.81% of sessions (from 0.12% in Q1).
- Claude, Mistral e Deepseek: Keep a marginal share of direct B2C traffic: Claude at 0.29%, Mistral at 0.02% and Deepseek closing the quarter at 0.01% of sessions.
Revenue breakdown Q2 2026
The breakdown of economic value generated by AI channels shows a realignment of revenue share toward the leading player, while also confirming some notable differences in efficiency between platforms:
- ChatGPT: Increases its share of total revenue, reaching 88.20% of overall earnings. The figure shows a monetization capacity slightly higher than its share of traffic (85.67% of sessions), pointing to a steady conversion propensity among its users.
- Other AI referrals: Account for 3.94% of the economic value generated, against a traffic share of 6.09%.
- Perplexity: Contributes 3.24% of total revenue, staying broadly in line with its session share (4.12%).
- Gemini: Stands at 2.18% of revenue, showing a slightly lower economic conversion rate than the traffic volume it generates (3.60%).
- Copilot: Remains the channel’s main anomaly. Despite a marginal session volume (0.12% of the total), it generated 2.06% of total revenue, suggesting that visits driven by the Microsoft assistant tend to come with higher average order values or stronger transactional intent.
- Claude e Mistral: Claude generates 0.30% of revenue, while Mistral shows its first direct signs of monetization, though still at very low levels (0.09%).
Methodological note: tracking and attribution bias (Q2 2026)
Starting in May and June 2026, the introduction of the “ai-assistant” channel in Google Analytics 4 allowed sessions originating from conversational assistants to be reclassified. Interpreting each player’s share, however, requires accounting for two important technical dynamics:
- ChatGPT: OpenAI automatically applies specific UTM parameters (utm_source=chatgpt.com / utm_medium=ai-assistant) to all outbound links. This makes it possible to accurately track clicks generated by the native mobile app, which would otherwise be classified as Direct or (not set) traffic.
- Gemini: Unlike ChatGPT, Gemini often suggests links that route the user to Google search pages (SERPs or Google Shopping) rather than directly to the ecommerce domain. The subsequent step to the merchant’s site is consequently logged as Organic or Paid traffic, causing Gemini’s referral traffic to be undercounted.
Industries most affected by AI traffic (Q2 2026)
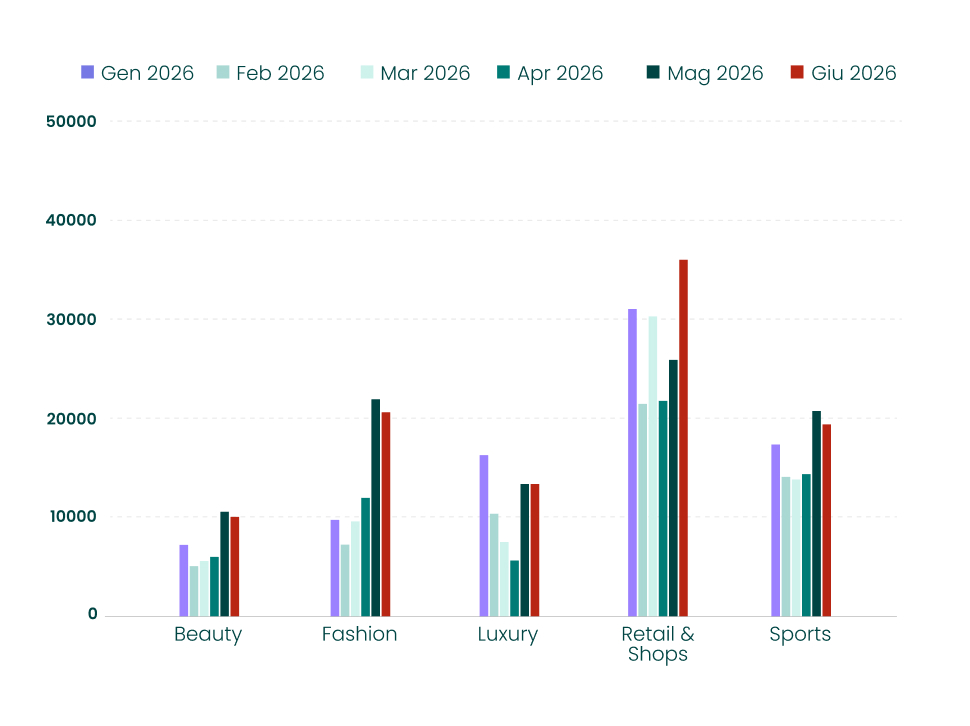
The second quarter of 2026 shows a marked shift in the balance between product categories, driven by a sharp jump in sectors with high technical and informational content.
The Hard Goods segment (consumer electronics and technology) takes the top spot, jumping to 24.2% of total traffic, a sharp rise from 15.7% in Q1.
This acceleration, driven in particular by June’s volumes, confirms that users are increasingly turning to conversational assistants to compare specs, features and complex products before buying.
Retail & Shops drops to second place while still holding a solid 21.6% share, a relative decline from 29.6% the previous quarter. The Fashion sector also recovers, rising to 12.9% (from 9.6% in Q1), helped by the change of season and summer collections.
Sports (13.8%) and Home & Design (13.2%) remain stable, while the Luxury sector continues to contract, dropping to 7.4% (from 11.3% in Q1).
Traffic distribution detail for Q2 2026:
- Hard Goods: 24.2% (sharp growth)
- Retail & Shops: 21.6% (relative decline)
- Sports: 13.8% (broadly stable)
- Home & Design: 13.2% (stable)
- Fashion: 12.9% (recovering)
- Luxury: 7.4% (declining)
- Beauty: 6.6% (slight growth)
- Food: 0.1% (stable)
- Kids: 0.1% (stable)
Cosa ci dicono questi dati
Nel secondo trimestre del 2026 i volumi continuano a crescere, con un +37,7% rispetto al Q1. Il fatto che le visite durino meno (44 secondi) ma l’aggiunta al carrello resti alta al 7,3% ci dice una cosa chiara: le persone usano l’AI prima di entrare sul sito.
Quando atterrano sull’ecommerce hanno già le idee chiare e vanno dritte al punto. L’aumento di settori come Hard Goods, insieme alla tenuta del Retail e alla ripresa del Fashion, conferma che questi strumenti servono soprattutto per confrontare schede tecniche e prodotti complessi. L’AI non si usa più solo per prendere spunti, ma per fare comparazioni pratiche prima di comprare.
I dati del Q2 mostrano anche quanto sia importante leggere i numeri con occhio critico. ChatGPT domina la classifica anche perché traccia meglio i clic dall’app mobile grazie agli UTM, mentre Gemini fa spesso da “ponte” e manda le persone sulle pagine di ricerca di Google.
Questo significa che una parte del traffico generato da Gemini finisce poi conteggiata sotto la ricerca organica o a pagamento. Per chi vende online, la sfida per i prossimi mesi è semplice: rendere i dati dei prodotti facili da leggere per i modelli AI, in modo da farsi trovare pronti quando l’utente inizia a informarsi.
ECOMMERCE TIP
Migrazione Shopify
Come gestirla senza perdita di dati
ECOMMERCE TIP
EA Advertising
La trasformazione dei videogiochi in piattaforme pubblicitarie